Building Node-RED Dashboard with DHT11 Sensor
In this tutorial we will create a Node-RED dashboard that will use the DHT11 sensor to measure the temperature and humidity in a room. We will also use the Node-RED flow to send the temperature data in a gauge to display. The DHT11 sensor is a very cheap and easy to use sensor. The sensor is connected to a Node-RED flow that will send the current temperature and humidity to Node-RED dashboard. Let’s get started with building Node-RED dashboard with DHT11 sensor.
Material Required
- Raspberry Pi 3/4 with Raspbian OS installed
- DHT11 Sensor
- Jumper wires
How it Works?
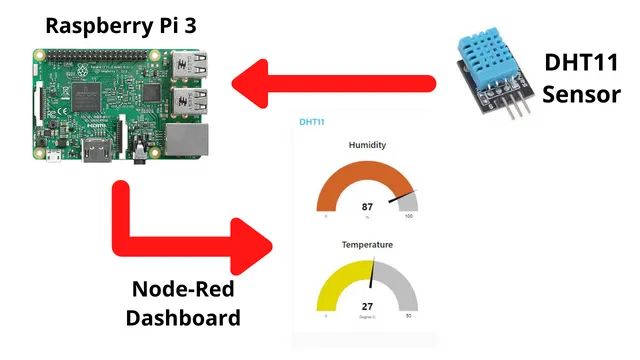
The DHT11 temperature and humidity sensor is connected with Raspberry Pi. The sensor is collecting the data and sending it to Raspberry Pi. In this raspberry pin Node-Red is getting the data and displaying it in a dashboard.
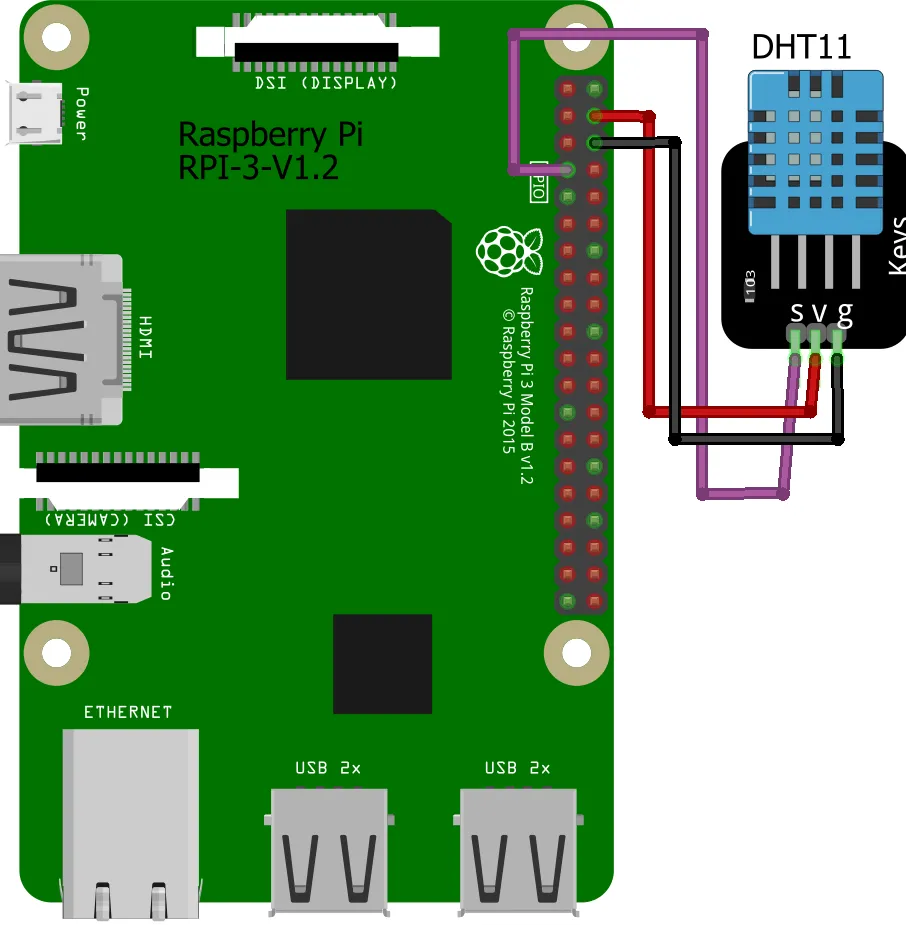
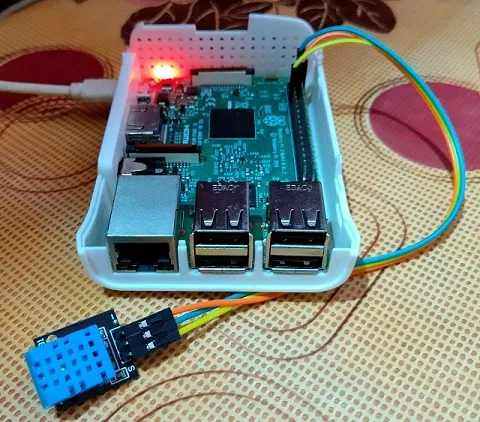
Connecting the sensor
DHT11 sensor’s signal pin is connected to GPIO4 of Raspberry Pi. Along with this the VCC and GND pins of the sensor is connected with the +5v and GND pin of raspberry pi respectively.
Setting up Node-RED in Raspberry Pi
Mostly Node-Red is installed on Raspberry Pi operating system. In case it is not installed, then you may check this article to install Node-RED on Raspberry Pi. Run the below command to start the Node-Red.
Command | Used For |
node-red-start | Use to start Node-RED again |
node-red-stop | Use to stop Node-RED |
node-red-log | Use to view the recent log output |
sudo systemctl enable nodered.service | Use to autostart Node-RED at every boot |
sudo systemctl disable nodered.service | Use to disable autostart on boot |
Configuring the Dashboard prerequisites
After starting the Node-RED, open chrome either on raspberry pi or on your computer (make sure your computer is connected to the same network as Raspberry Pi is connected). If you are doing it on your computer then try to open below URL.
http://your_raspberry_pi_IP_Address:1880
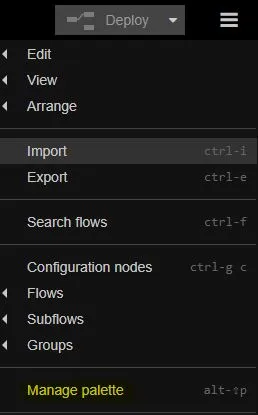
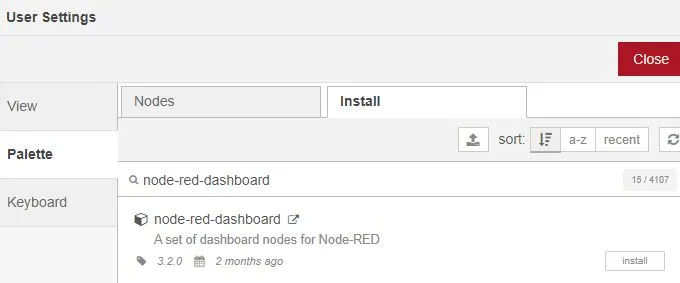
Once the Node-RED portal is opened, locate Manage Palette and click on it.
Now click on install to download the required nodes. You can search the name as shown below and install them.
- node-red-dashboard
- node-red-contrib-dht-sensor
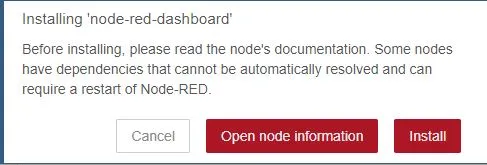
It will ask for permission to install. Just click on Install.
Creating the Flow
On left hand side of the portal you will se the nodes. Drag and drop the nodes in flow area at the center. Now connect the nodes and configure them as shown below.
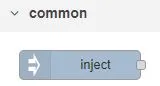
On the left hand side you will see different nodes listed. Drag and drop the below nodes
- Inject
- Function
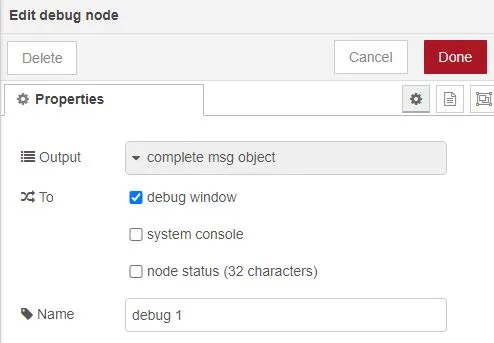
- Debug
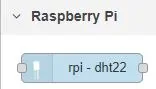
- rpi-DHT22
- Gauge
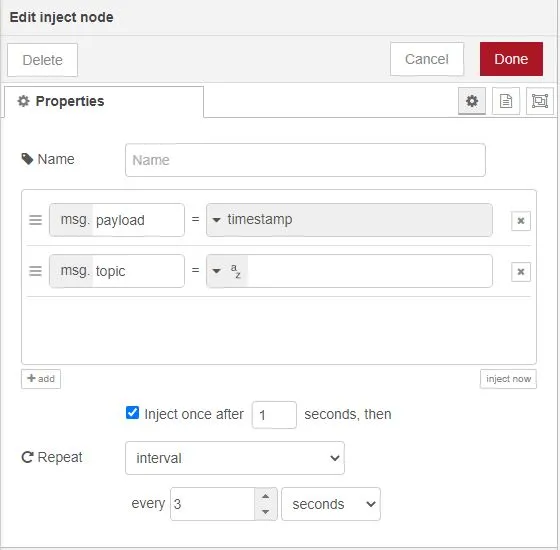
In Inject node set the below properties
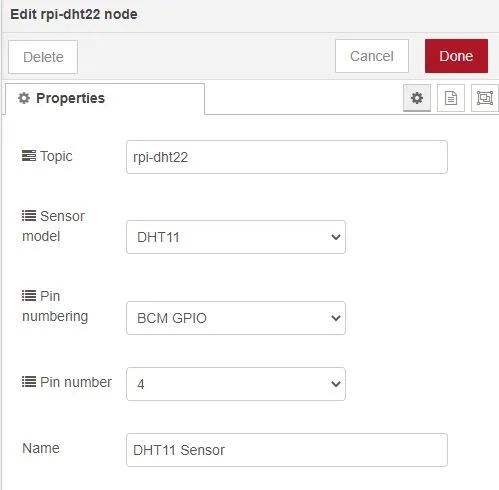
Similarly in rpi node update the configuration shown below. Here pin number is set to 4 which indicates the signal pin of DHT11 will be connected to GPIO4 of Raspberry Pi.
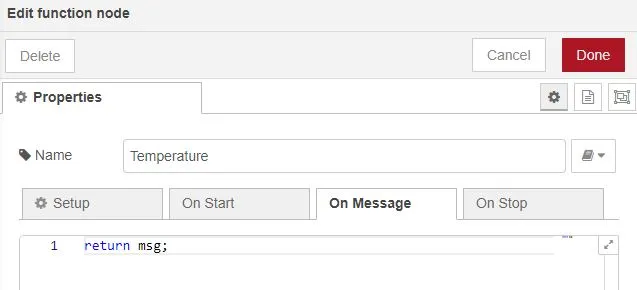
By default below line of code will be present in case it isn’t then add this in function nodes for temperature.
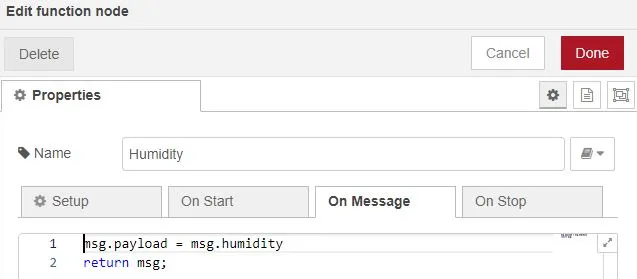
For humidity add the below lines
The gauge will be connected to rpi node to get the raw data and check if the connectivity is working properly or not.
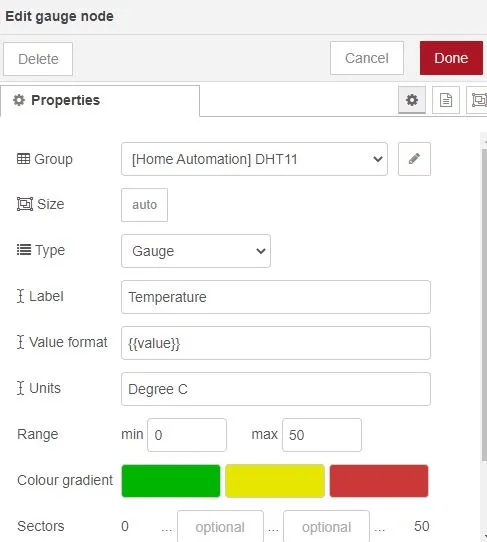
In Temperature gauge node add the below details
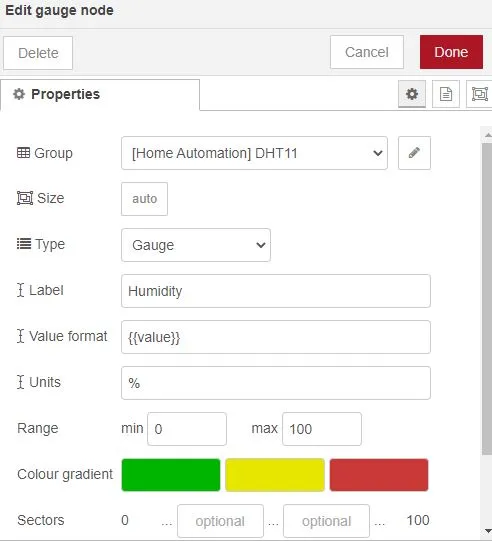
Update below in the humidity gauge node
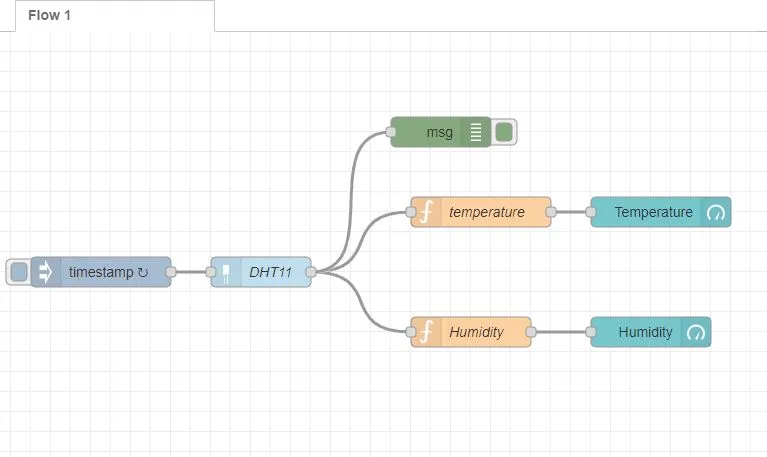
Finally your flow will look something as shown below after connecting them. Click on the Deploy button in your top right hand corner.
Building and Testing
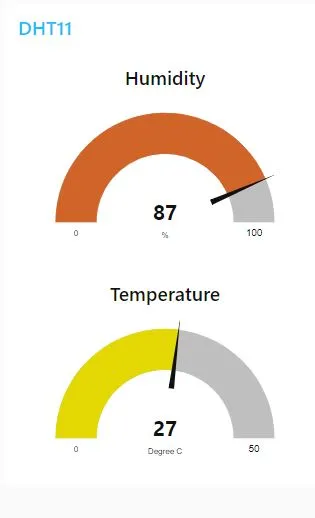
After connecting the DHT11 sensor with raspberry pi and setting up the Node-RED, now its time to see test. For accessing the dashboard open the below url from your browser.
http://your_raspberry_pi_ip_address:1880/ui
Now you will see the below output. The DHT11 sensor data will be displayed with real-time updates in temperature and humidity gauge respectively
Summary
In this blog post, we have seen building Node-RED dashboard with DHT11 sensor to monitor air quality. The air quality data will be received from the DHT11 sensor and will be processed by the Node-RED flow diagram to generate a dashboard. The air quality data will be displayed in a gauge, along with the current temperature and humidity. Hope you like this tutorial and please share this with IoT beginners.
Related Tutorials:
- IoT Smart Plant Watering System Project
- Monitoring Weather Data using BMP280 and Blynk 2.0
- Web Server Pulse Oximeter using NodeMCU ESP8266
- Getting Started with Arduino IoT cloud using NodeMCU and DHT11
- Weather Station with Raspberry Pi PICO and DHT11
- Controlling a servo motor using Raspberry Pi Pico
- Configuring BMP280 Sensor with Raspberry Pi
- Weather Station with BMP280 Sensor and Raspberry Pi Pico
- IoT Pulse Oximeter Using NodeMCU MAX30100 & Blynk
- DIY Digital clock with RTC DS1307 and Raspberry Pi PICO
- IoT Security Camera using ESP32-Cam Blynk and PIR Sensor
- ESP8266 based IoT Panic Alarm for Old Age People using Blynk
- How to send sensor data to Thingspeak using Raspberry Pi
- ESP32-CAM based Email Notification System
- ESP32 based Gas Leakage Detection using Email Notification
- IoT based Motion Detection Alarm using ESP8266 and Blynk
- IoT based Fire Security Alarm System using NodeMCU
- NTP Digital Clock using ESP8266 and OLED Display
- DHT11 Sensor with ESP-NOW and ESP32
- DHT11 based Temperature Humidity Monitoring IoT Project

